Mean Time Between Failures
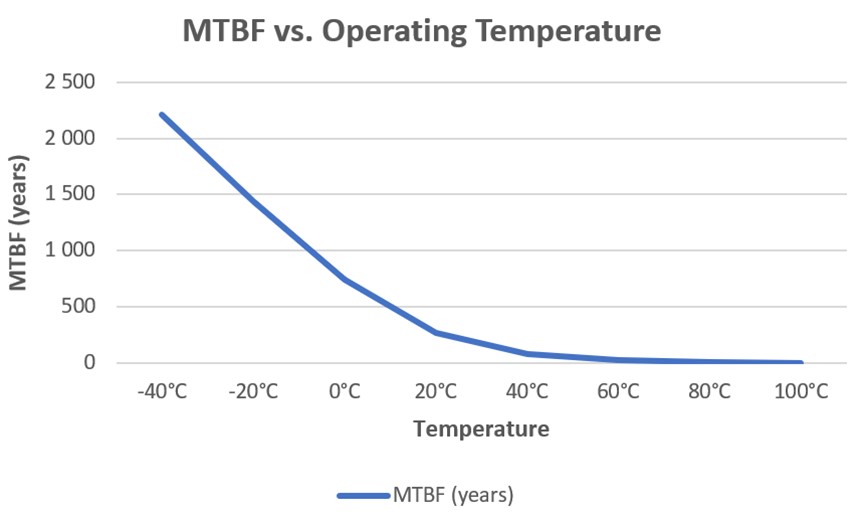
The analysis was carried out for operating temperatures varying from -20 to 100ºC. The following table presents the predicted MTBF and failure rate values.
|
Temperature °C |
MTBF |
Failure Rate (Failure/106 hours) |
|
|
Hours |
Years |
||
|
-20 |
12642225 |
1443 |
0.0791 |
|
0 |
6489293 |
741 |
0.154.1 |
|
20 |
2345766 |
268 |
0.426.3 |
|
40 |
673718 |
77 |
1.484.3 |
|
60 |
185532 |
21 |
5.389.9 |
|
80 |
54118 |
6 |
18.478 |
|
100 |
17260 |
2 |
57.937 |
 ©
©